Biting into the Pizza Category Through Actionable Consumer Insights
Use Actionable Insights from InMobi Pulse to Make Data-Driven Advertising Work for You.
Data-driven advertising that drives real connections with today’s mobile-first consumers will only work when it’s powered by actionable customer insights. Data in advertising is not all the same. The goal is to power your digital advertising strategy with both first- and third-party data that yields actionable insights that can directly lead to positive consumer experiences.
So how would this work in the real world? We used cutting-edge market research and consumer insights solution
InMobi Pulse to look at some of the biggest quick-service pizza restaurants in the United States. By analyzing the unaided carrier data on these major QSR properties, we got unvarnished customer insights that can dramatically improve any advertising campaign.
LEARN MORE
Reviewing the Data: Analytics on the Top Pizza Properties
To get a sense of the current state of the QSR pizza space today, we analyzed the mobile websites and mobile apps of three of the biggest pizzamakers in the U.S.: Domino’s, Pizza Hut and Papa John’s. Using our carrier-verified, high-quality data, we can see what makes their customers tick.
InMobi Pulse builds a holistic understanding of the customers from across data sources ranging from the InMobi ad exchange which reaches 1.6 billion users globally to permissively-sourced deterministic first-party carrier data to stated feedback directly from the customers. So what does the data reveal?
Who Are Their Customers?
Everybody loves pizza, so it’s no surprise that each of the three brands has a fairly wide base of support:
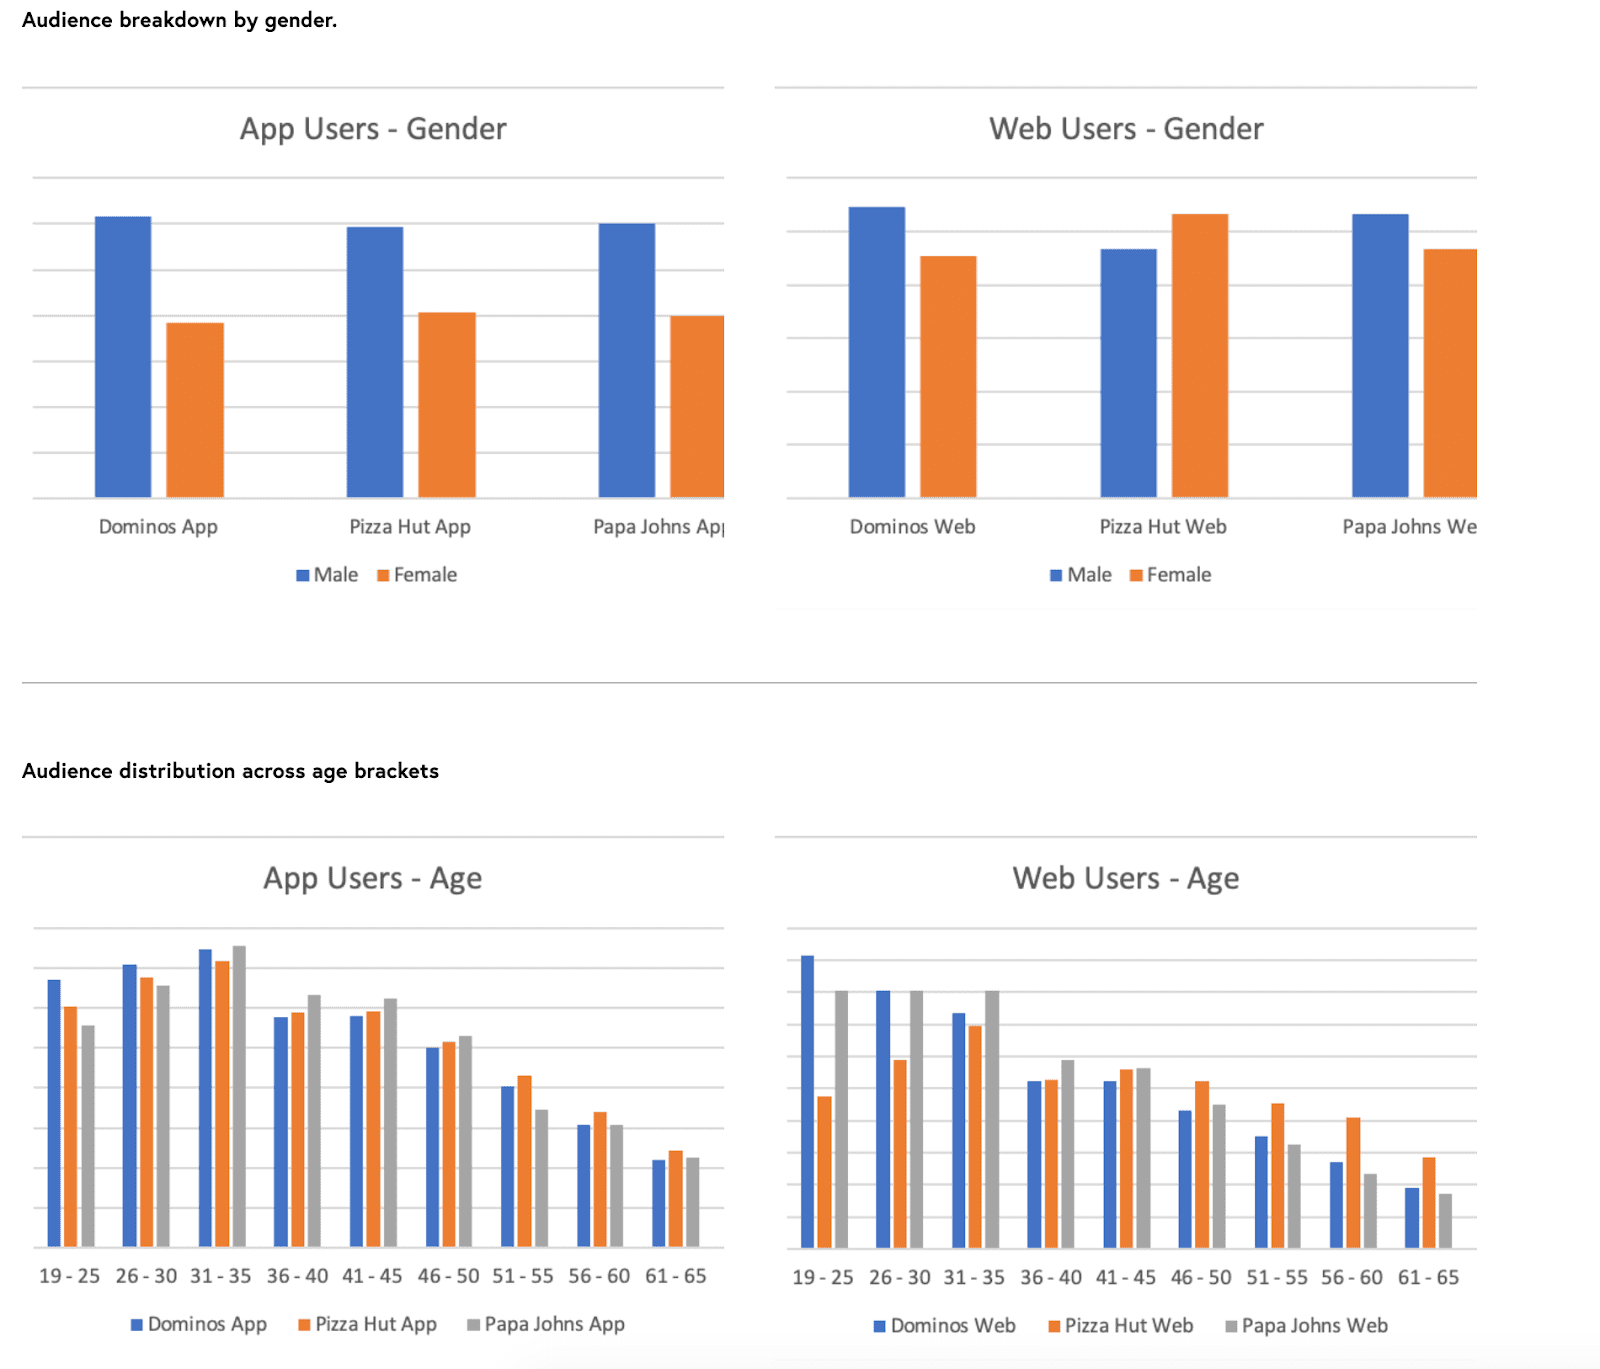
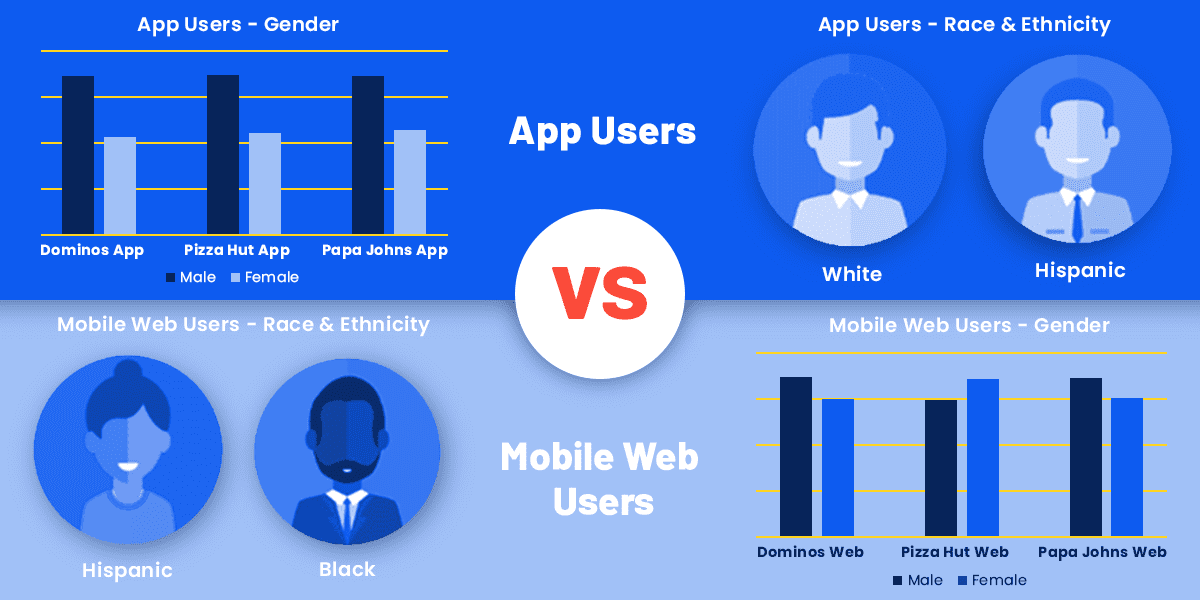
- The majority of the users of the Papa John’s, Domino’s and Pizza Hut apps are male. But that breakdown doesn’t always carry over to websites. The bulk of the top visitors to the Domino’s and Papa John's mobile websites are male, but more females than males visit the Pizza Hut website.
- Most app users are White or Hispanic, while most website visitors are Hispanic or Black/African-American.
How Old Are Their Customers?
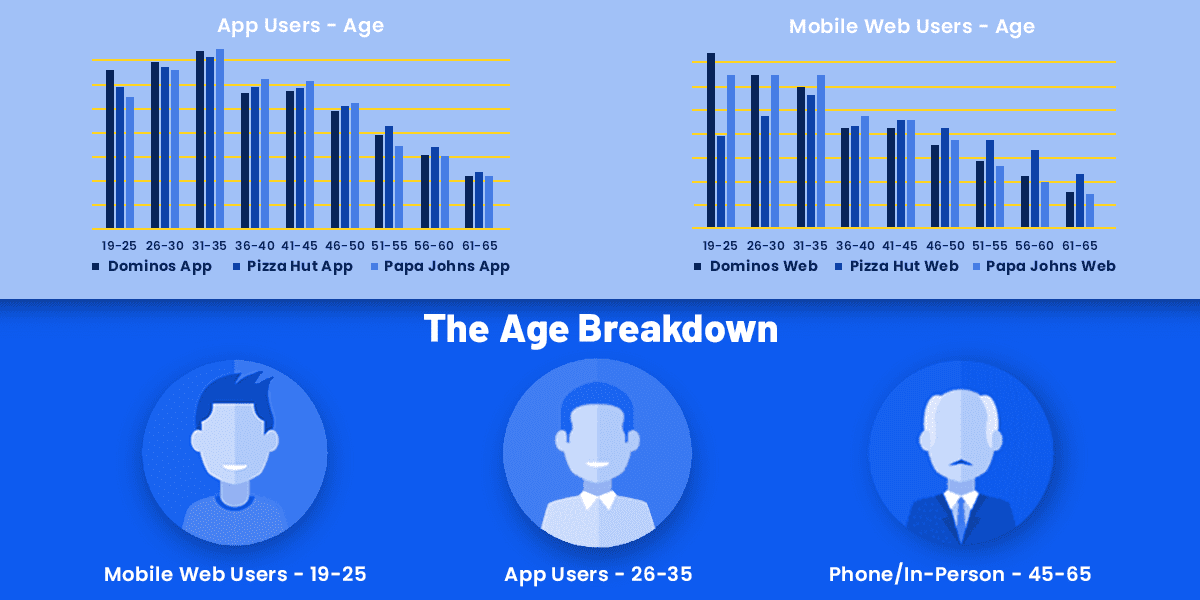
- For all three brands, the majority of app users are between the ages of 26 and 35. But, Papa John’s is more likely than its competitors to have app users between the ages of 36 and 50. Pizza Hut is more likely than either Papa John’s or Domino’s to have app users between 51 and 65, but the bulk of its app users skew younger than that.
- How do their web users shake out? Domino’s is far more likely than the others to have web visitors under 26. Overall, the bulk of web traffic that all three major brands receive is from people under 36 years old.
- Over half of consumers of these three major pizza brands that are over 45 years old are more likely to order food over the phone or in-person than they are to use a website or an app to make an order.
Where Are Their Customers Located?
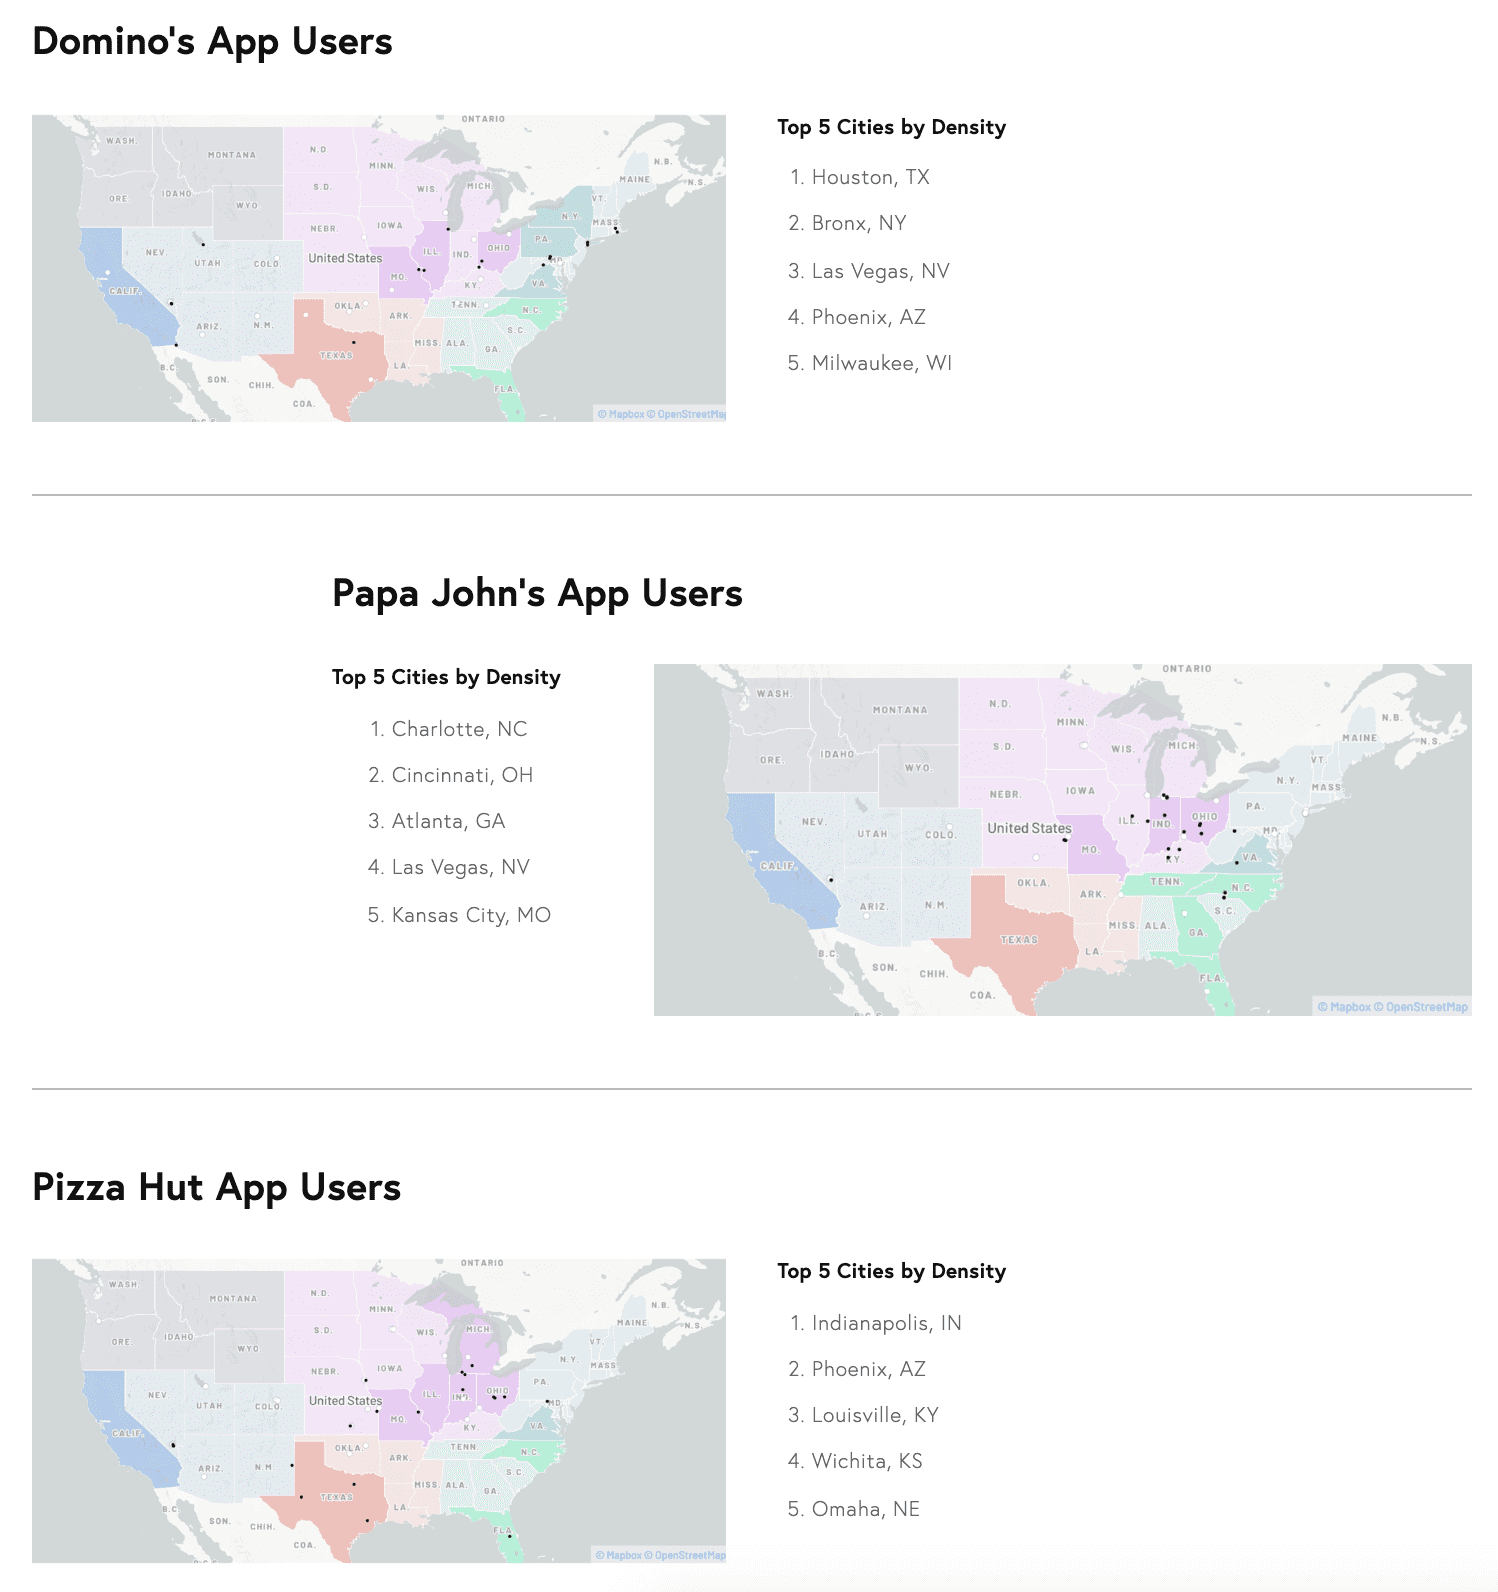
- People in Phoenix and Las Vegas really love their pizza! Las Vegas was among the top five cities for Domino’s and Papa John’s, while Phoenix was a top five city for both Domino’s and Pizza Hut.
- Domino’s app users are likely to be in some of the fastest-growing and largest cities in the U.S., including New York City and Houston along with Phoenix and Las Vegas.
- Papa John’s app users are likely to be in the Southeast or Midwest, with top metros like Charlotte, Atlanta, Cincinnati and Kansas City.
- Pizza Hut has a loyal app user base in the middle of the country. Its top cities include Indianapolis, Louisville, Wichita and Omaha.
.png)
What Do They Care About?
- According to Experian Audience Mosaics, most app users can be classified as young, working-class families and single-parent households living in small, established city residences.
- Domino’s and Pizza Hut app users are also commonly middle-aged lower-income singles and divorced individuals in transitional small towns and exurban apartments.
- Papa John’s is more likely than the other two brands to have app users classified as young, middle-class families in scenic suburbs leading active, family-focused lives.
- Pizza Hut and Domino’s use price and value to entice customers, which helps to explain why customers of these brands also like Taco Bell, Little Caesar’s and Subway. Papa John’s customers, however, tend to focus a bit more on food quality and convenience, which is why their customers also show a high affinity for Jimmy John’s and Chipotle.
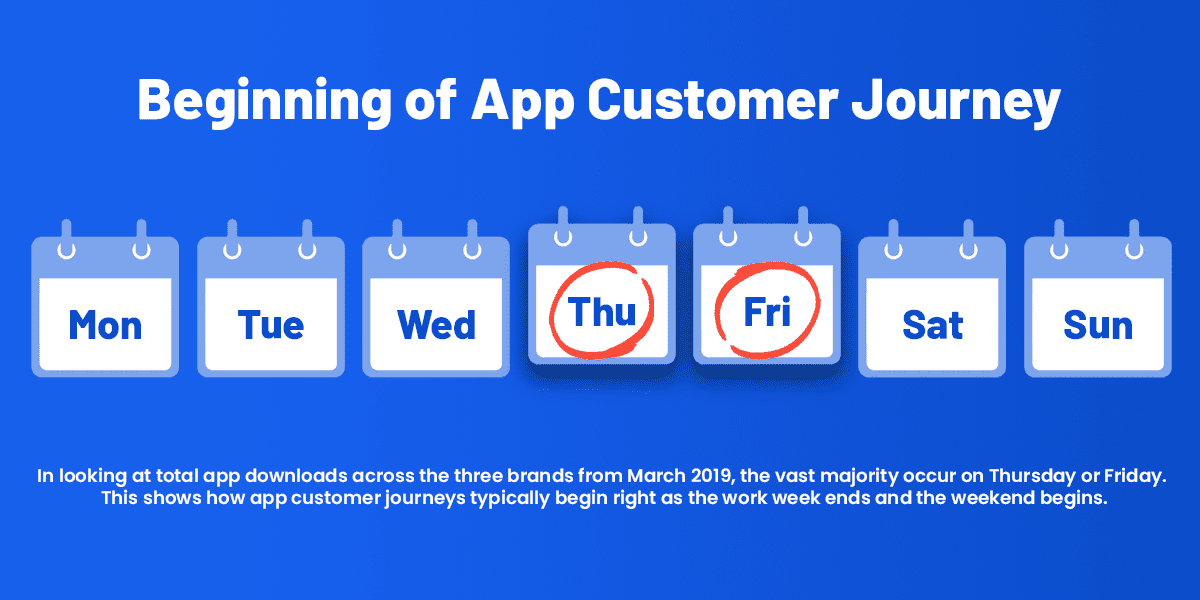
- In looking at total app downloads across the three brands from March 2019, the vast majority occur on Thursday or Friday. This shows how app customer journeys typically begin right as the work week ends and the weekend begins.
.png)
Interested in accessing these kinds of insights for yourself? Sign up for a free demo of
InMobi Pulse today.
DEMO REQUEST
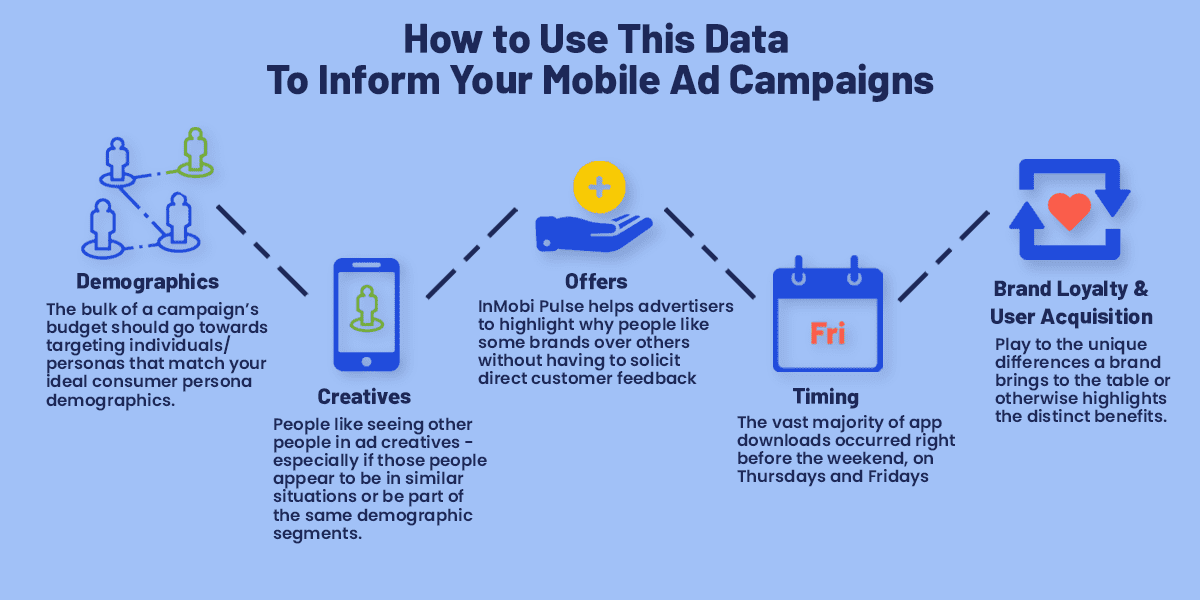
How to Use This Data To Inform Your Mobile Ad Campaigns
These insights are interesting, but how can all of this information from
InMobi Pulse be used to more intelligently allocate in-app and mobile ad spend? Here are a few options:
- Demographics: Is your brand more like Pizza Hut or more like Papa John’s? Ideally, the bulk of a campaign’s budget should go towards targeting individuals/personas that match your ideal consumer persona demographics.
- Creatives: People like seeing other people in ad creatives - especially if those people appear to be in similar situations or be part of the same demographic segments. Information gleaned from InMobi Pulse can be used to develop personalized ads for certain demographics.
- Offers: As shown above, InMobi Pulse helps advertisers to highlight why people like some brands over others without having to solicit direct customer feedback (although this can easily be done through InMobi Pulse too). After all, a brand focused on cheap deals may not see much success with ad creatives touting high-quality ingredients.
- Timing: Our analysis showed that the vast majority of app downloads occurred right before the weekend, on Thursdays and Fridays. Any pizza chain—or really any QSR brand with an app—looking to acquire new app users through in-app advertising would be wise to run their campaigns during these time periods.
- Brand Loyalty: In the chain pizza space, there isn’t a lot of brand loyalty. Individuals are likely to have multiple pizza delivery and ordering apps on their phones. Thus, bashing the competition in advertising may not be ideal; rather, campaigns may be more successful if they play up the unique differences a brand brings to the table or otherwise highlights the distinct benefits or a particular app or web property.
- User Acquisition: As our data highlights, app users can be very different than mobile web customers. Pizza Hut is a good example of this dynamic. While their app users are likely to be male, under 36 and white, their mobile web users skew slightly older and are more likely to be female and Hispanic. This is a prime example of why the kinds of new users a brand may want to go after for its app could be very different than who they want to acquire for their mobile web channels.
How do you use consumer insights to inform your media buying? Let us know on social media! We’d love to hear from you on
Twitter, Facebook and LinkedIn.
GET IN TOUCH
Our Commitment to Data Privacy: What You Need to Know About This Data
We take user privacy extremely seriously. We meet the most rigorous governance, compliance, and security standards. We have collaborated with consumer advocacy groups and incorporates guidelines from multiple federal government agencies to define industry-leading practices for data governance in the U.S.
Users retain complete control over the data they provide, and have a choice in whether they participate and transparency as to how their data is utilized. Subscribers have constant access to their privacy elections through multiple telco touchpoints. The patented anonymization platform ensures data sets are 100% secure, and are refreshed to ensure all data are anonymized.


